What is Velocity Time Graph?
A velocity time graph (v – t graph) is a graph of velocity along the y-axis versus time along the x-axis which is commonly used to solve problems in rectilinear acceleration. The graph can be in different shapes depending on whether the velocity is increasing, decreasing, or constant.
The v – t graph is very useful because it gives very useful information about the motion of objects. We can easily obtain the following information from the graph:
- Acceleration
- Retardation (Deceleration or negative acceleration)
- Displacement
- Average speed
The motion of objects can form shapes such as a square, triangle, trapezium, rectangle, or a combination of two or more shapes. Thus, the sum of the areas of the shapes formed corresponds to the distance moved, covered, or travelled by the objects.
Explaining Velocity Time Graph
In a v – t graph, we have v along the y-axis and t along the x-axis. For us to find our gradient or slope, we need to divide velocity by time. This is more like slope (s) is equal to x/y (s=x/y). Therefore, when we substitute the value of x for v and y for t, and a for s. Thus, we will have s=v/t.
You need to also remember that acceleration (a) is velocity over time (v/t). Therefore, we can finally conclude that a=v/t. Hence the result of velocity will always give us acceleration. Since the SI unit of acceleration is in meters per second square (ms-2), we can see that the si unit of v – t graph is also in ms-2. Additionally, the si unit of time is in seconds (s). Velocity is measure in meters per second (m/s).
Formula For calculating Velocity Time Grap
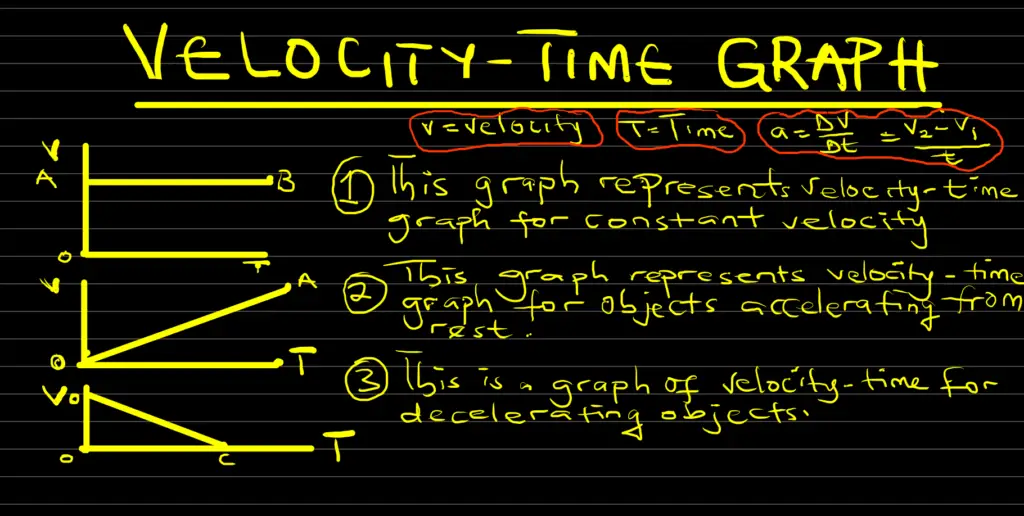
The formula for calculating velocity-time graph is: a = Δv / Δt which can be rewritten as a = v – u / t
We can also write it this way:
Slope (acceleration, a) = Change in velocity (v – u) / change in time (t2 – t1)
Thus,
a = (v – u) / (t2 – t1)
or
a = (v – u) / t
We can also remember that a = Δv / Δt
Note: The approach to the type of formula you want to use, depends on the question available to you.
Types of Velocity-Time Graph
We have three types of velocity-time graphs:
1. V – T Graph for Objects Moving With Constant Velocity
The description of the v – t graph of an object moving with a constant velocity is number one (1) in the figure above. As we can see, Velocity did not change on the y-axis it remains constant. On the other hand, the time along x-axis keeps changing. Therefore, the change in velocity is constant for this type of graph. The graph is constant.
2. V – T Graph for Objects Accelerating From Rest
For this type of graph, the object starts from the rest or zero position. The velocity along the y-axis keeps increasing. Additionally, the time is also increasing. The figure above (number 2) describes the v – t graph of objects accelerating.
3. V – T Graph of Objects Decelerating
The v – t graph of objects decelerating implies that the velocity is decreasing while the time is increasing. The figure above (number 3) perfectly describes this type of graph.
V – T Graph Solved Problems
Here are solved problems to help you understand how to calculate v – t graph:
Problem 1
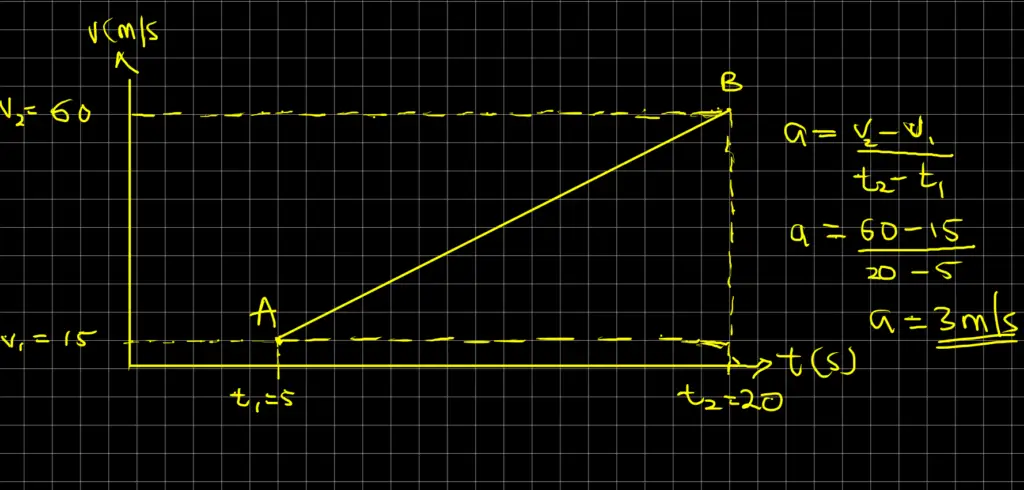
A body moving with a uniform acceleration, a has two points (5, 15) and (20, 60) on the v – t graph of its motion. Calculate a.
Solution
Data: Information from the question
Our acceleration, a, on the v – t graph is the same as the slope of the graph. Therefore, we can easily deduce from the question that:
v = 60 m/s, u = 15 m/s, t2 = 20 s, and t1 = 5 s
By applying our formula below, we will obtain:
a = (v – u) / (t2 – t1) = (60 – 15) / (20 – 5) = 45 / 15 = 3 ms-2
Therefore, the result of v – t graph (acceleration) is 3 meters per second square (ms-2)
Problem 2
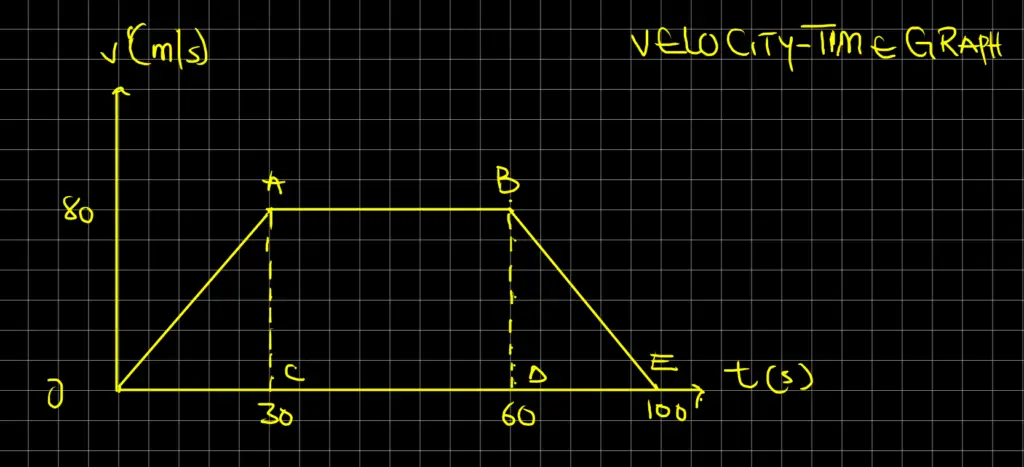
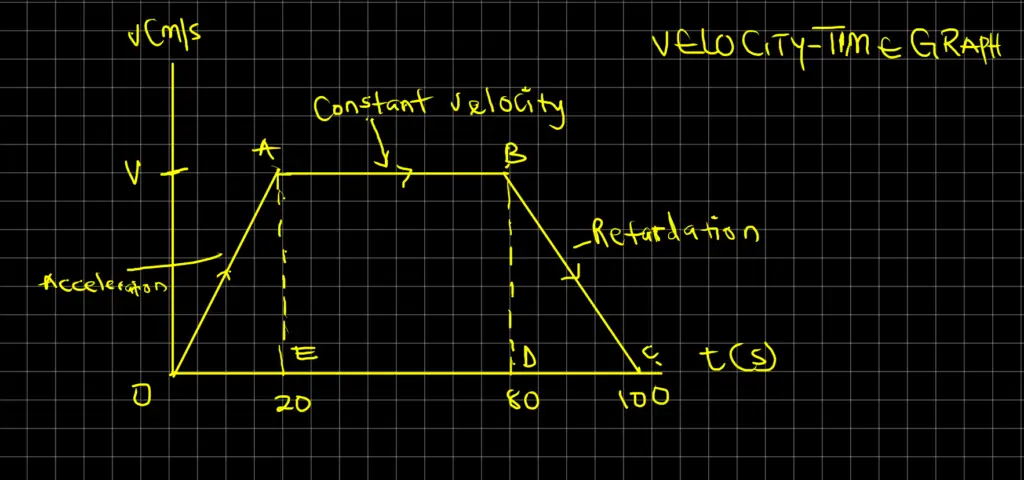
A car starting from rest accelerates uniformly and attains a speed of 80 meters per second in 30 seconds. It maintains this steady speed for another 30 seconds. It then slows down uniformly until it comes to rest in the next 40 seconds. Sketch the v – t graph for the motion of this car. Obtain from the graph the uniform acceleration during the first stage of the journey, and the retardation during the last stage of the journey. For how long did the car travel all along?
Solution
The diagram of the v – t graph is shown in the figure below:
From the above graph, we have:
Acceleration = slope = OA
AC = Δv = 80 – 0 = 80 m/s
OC = Δt = 30 – 0 = 30 s
Since a = Δv / Δt, we will have: OA = AC / OC
Thus,
OA = AC / OC = 80/30 = 2.7 m/s2
To find the deceleration (retardation) = BE, we will say:
BE = BD /DE = (80 – 0) / (100 – 60) = 80/40 = 2 m/s2
The total time it takes, t = 30 + 30 + 40 = 100 s
Problem 3
Assuming a car starting from rest travels on a level road and gradually increases its velocity at the end of each second. If the velocity attained is as shown in the table below:
| Time, t (s) | 0 | 1 | 2 | 3 | 4 | 5 |
| Velocity, v (m/s) | 0 | 5 | 10 | 15 | 20 | 25 |
Use the above table to plot a graph of v vs t and determine the acceleration (a).
Solution
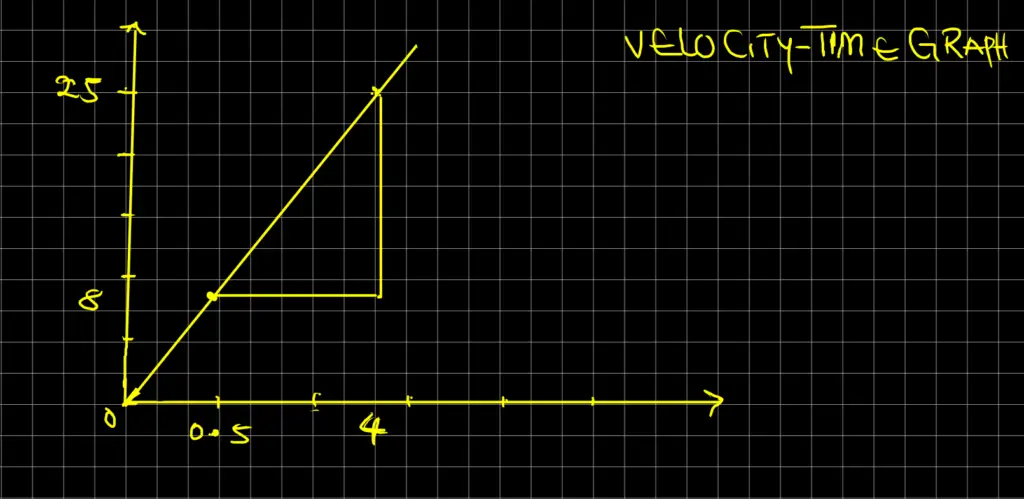
From the above graph, we can easily deduce:
The acceleration, a = AB = AC / BC = (25 – 8) / (4 – 0.5) = 4.9 ms-2
Problem 4
A train starts from rest and accelerates uniformly at the rate of 2 m/s2 until it attains a maximum velocity in 20 seconds. It maintains this velocity for 60 seconds and then retards uniformly to rest after a further 20 seconds.
1. Draw a graph of the motion
2. Use the graph to determine: a) The maximum speed velocity reached b) The retardation, and c) The distance covered.
Solution 1
Solution 2
a) Acceleration, OA = AE / OE
This implies: 2 = (v – 0) / (20 – 0)
Making v subject of the formula, we will obtain:
v = 2 x 20 = 40 m/s
b) The retardation, BC = BD /DC
Thus, BC = a = (0 – v) / (100 – 80) = – 40 / 20 = – 2 m/s
The negative sign indicates that the train is decelerating which can be referred to as retardation or negative acceleration.
d) The total distance, s = Area under the curve and the time axis
s = Area of trapezium OABC
Thus, s = (1/2) (AB + OC) AE
s = (1/2) (60 + 100) x 40 = 0.5 x 160 x 40 = 3200 m
Problem 5
Draw the v – t graph of a car that starts with an initial velocity of 15 km/h and accelerates uniformly at 5 m/s2 until it attains a maximum of 30 km/h. It then maintains this speed for the next 2 minutes. Use the graph to determine:
- The total distance covered before it maintains the maximum velocity reached
- Total distance covered in the entire journey
Solution
We need to first convert our units from the question into basic units
OA = u = 15 km/h = 15 (1000/3600) = 15 x 0.28 = 4.2 m/s
BE = v = 50 km/h = 50 (1000/3600) = 50 x 0.28 = 14 m/s
Additionally, we have t = time it takes to attain the maximum velocity
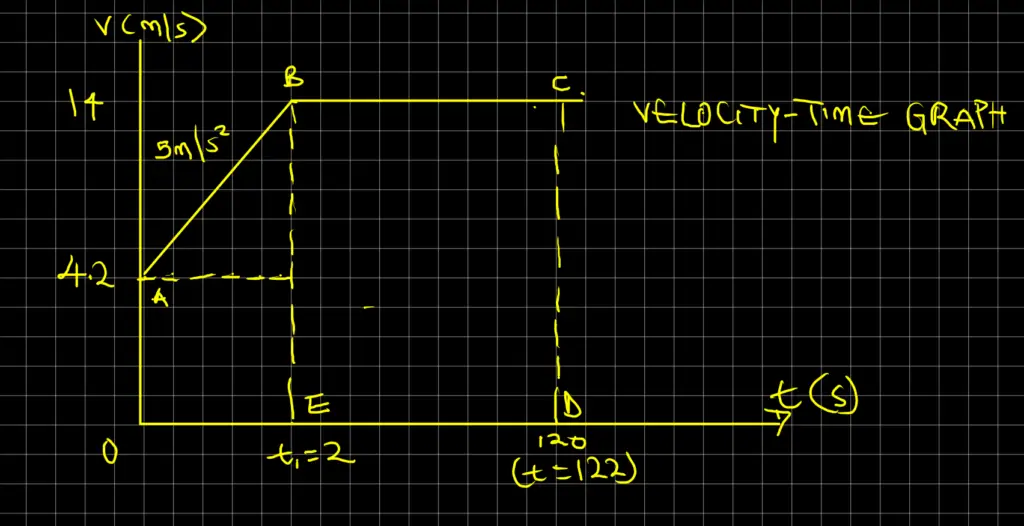
acceleration, AB = (BE – OA) / OE
Therefore, a = (v – u) / t
We can now substitute our data into the above formula
5 = (14 – 4.2) / (t – 0)
We will now make t subject of the formula to obtain:
t = 9.8 / 5 = 1.96 seconds
Our answer is approximately 2 seconds.
Solution 1
Total distance covered before it maintains constant speed, sc = (1/2)(OA + BE) x OE
We can now input our values into the above formula
sc = (1/2)(OA + BE) x OE = 0.5 x (4.2 + 14) x 2 = 18.2 m
Solution 2
The distance covered during the entire journey, sj = (1/2)(OA + CD) x OD
When we substitute our data into the above formula, we will obtain:
sj = (1/2)(OA + CD) x OD = 0.5 x (4.2 + 14) x 122 = 1110.2 m
Problem 6
A car runs at a constant speed of 15 m/s for 300 seconds and then accelerates uniformly to a speed of 25 m/s over a period of 20 seconds. This speed is maintained for 300 s before the car is brought to rest with a uniform deceleration in 30 seconds. Draw a v – t graph to represent the journey described above. From the graph, find:
- The acceleration while the velocity changes from 15 m/s to 25 m/s
- Total distance travelled in the time described.
- The average speed over the time described
Data
AB = 15 m/s, OH = 300 s, BC = 25 m/s, HG = 20 s, CD = 25 m/s, GF = 300 s, DE = 25, FE = 30 s
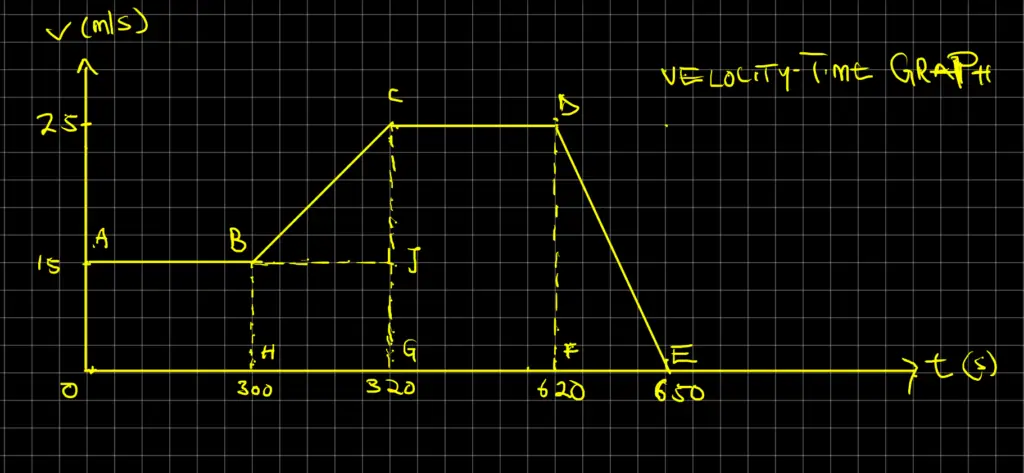
Solution 1
Acceleration = a = BC = CJ / BJ = (25 – 15) / (320 – 300) = 10 / 20 = 0.5 m/s2
Solution 2
Total distance covered = Area OABCDE
And Area OABCDE = ABHO + BCGH + CDFG + DEF
Total Distance = AB x BH + (1/2)(BH + CG) x HG + (CD x DF) + (1/2)(FE x DF)
We will now have
Total Distance = 300 x 15 + (1/2)(15 + 25) x 20 + 300 x 25 + (1/2)(30 x 25) = 12775 m
Solution 3
The average speed = Total Distance / Total time = 12775 / 650 = 19.65 m/s
Problem 7
A car starts from rest at checkpoint A and comes to rest at the next checkpoint B, 6 km away, in 3 minutes. It has first a uniform acceleration for 40 s seconds. Then a constant speed and is brought to rest with a uniform retardation after 20 seconds. Sketch a v – t graph of the motion. Determine:
- The maximum speed
- Retardation
Data
s = 6 km = 6000 m, t = 3 minutes = 3 x 60 = 180 seconds
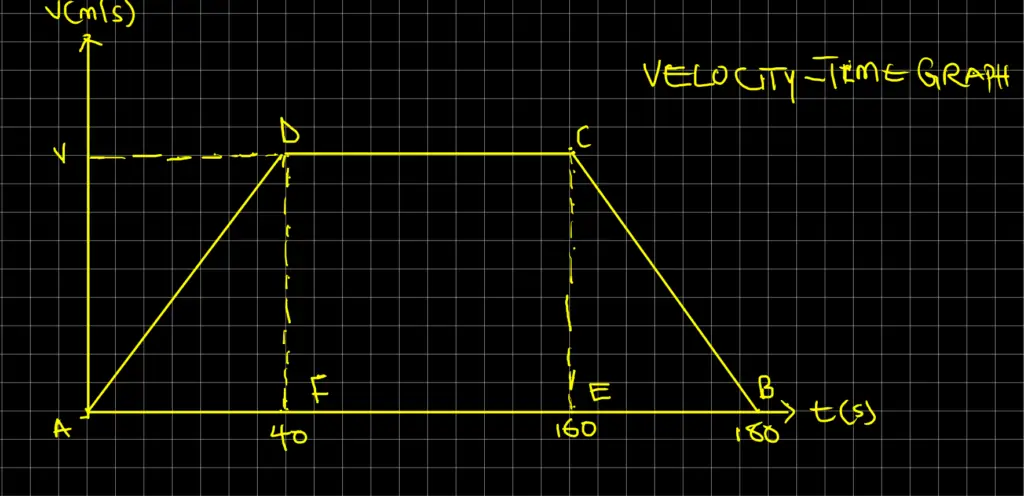
Solution 1
Maximum speed = v
Total distance, s = Area of trapezium ADCB
s = (1/2)(AB +DC) x v
Substituting our data from the graph, we will obtain
6000 = 0.5 x (180 + 120) x v
Making v subject of the formula, we will now have
v = 6000 / 150 = 40 m/s
Solution 2
Retardation, a = CB
Thus, CB = a = CE / EB = (40 – 0) / (160 – 180) = – (40/20) = – 2 m/s2
Problem 8
A body at rest is given an initial uniform acceleration of 8 m/s2 for 30 seconds after which the acceleration is reduced to 5.0 m/s2 for the next 20 seconds. The body maintained the speed attained for 60 s after which it is brought to rest in 20 s. Draw the v – t graph of the motion using the information given above. Using the graph, calculate the:
- The maximum speed attained during the motion
- Average retardation as the body is being brought to rest.
- Total distance travelled during the first 50 s
- Average speed during the same interval as in 3 above
Solution
Velocity attained during acceleration of 8 m/s2 for 30 s
initial velocity, u = 0, acceleration (a) = 8 m/s2, time (t) = 30 s
Using one of the kinematic equations: v = u + at = 0 + 30 x 8 = 240 m/s
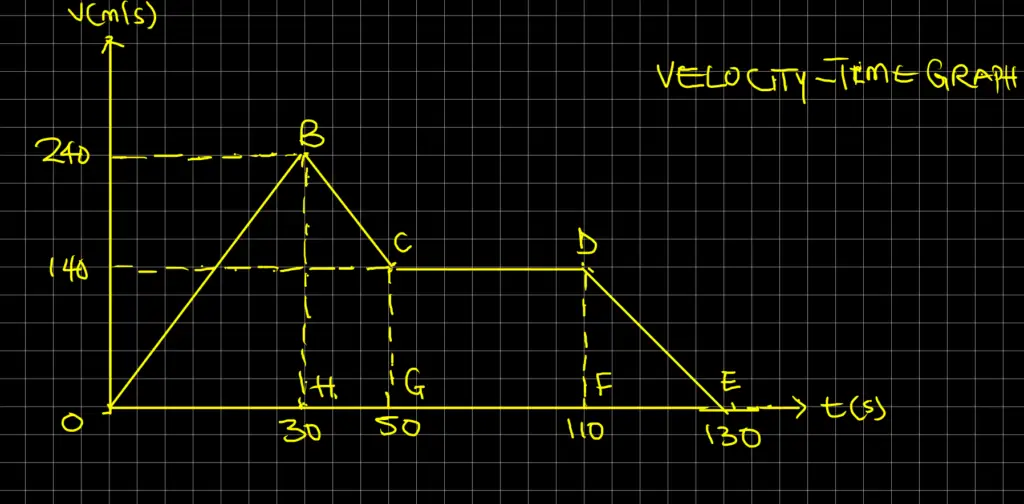
OB = 240 m/s, BC = 5 m/s2
We can now determine the velocity attained after retardation:
u = 240 m/s, a = 5 m/s2, and t = 20 s,
When we apply the formula v = u + at = 240 + (-5 x 20) = 140 m/s.
- Maximum speed attained = 240 m/s
- Average retardation, a = DE = (140 – 0) / (110 – 130) = 7 m/s2
- Distance = (1/2) x OH x BH + (1/2) x (BH + CG) x GH = 0.5 x 30 x 240 + 0.5 x (240 + 140) x 20 = 7400 m
- Average speed = total distance / total time = 7400 / 50 = 148 m/s
Problem 9
If a car starts from rest and moves with a uniform acceleration of 10 m/s2 for ten seconds, the distance it covers in the last one second of its motion is
Solution
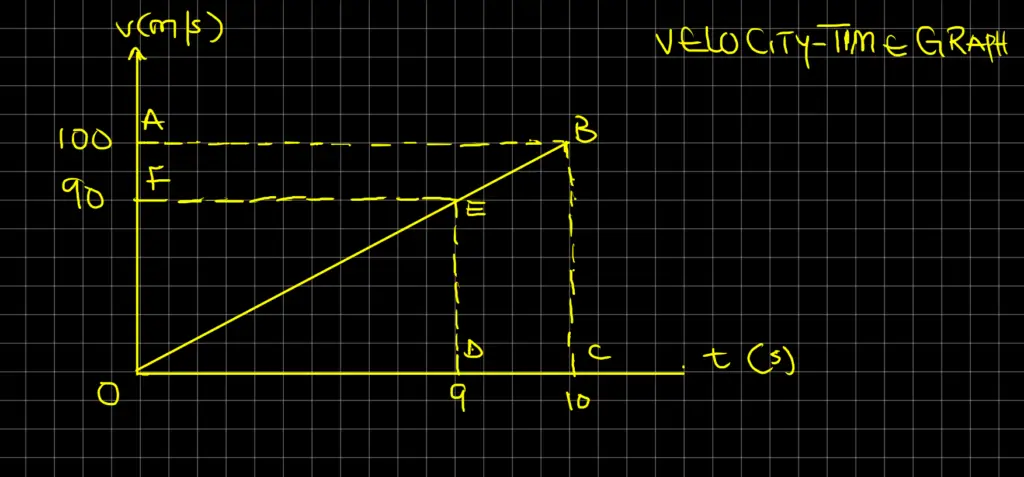
Initial velocity, u = 0, acceleration (a) = 10 m/s2, time (t) = 10 s, and v = ?
Using the formula, v = u + at = 0 + 10 x 10 = 100 m/s
Distance = (1/2) x OC x BC – (1/2) x OD x DE = 0.5 x 10 x 100 – 0.5 x 9 x 90 = 500 – 405 = 95 m
Problem 10
A body which is uniformly retarded comes to rest in 5 seconds after travelling a distance of 10 m. What is initial velocity?
Solution
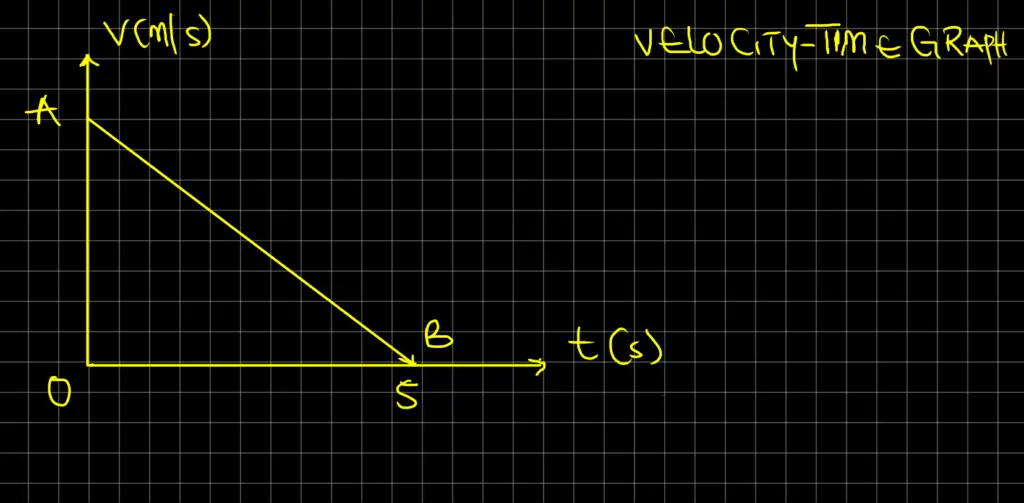
Area OAB = 10 m
(1/2) x OB x OA = 10
0.5 x 5 x OA = 10
After making OA subject of the formula, we will obtain:
OA = 20 / 5 = 4 m/s
Frequently Asked Questions
Q1. How to find displacement on a velocity-time graph?
A1. Find the area under the v – t graph, with positive areas representing displacements in the positive direction and the negative areas representing displacement in the negative direction.
Q2: What is a velocity-time graph?
A2: A v – t graph, also known as a v-t graph or speed-time graph, is a graphical representation that shows the relationship between an object’s velocity or speed and the time elapsed. It provides a visual depiction of how an object’s velocity changes over a given period.
Q3: How is a v – t graph represented?
A3: In a v – t graph, the velocity or speed is plotted on the y-axis (vertical axis). While the time is plotted on the x-axis (horizontal axis). The graph consists of a line or curve that connects the plotted points, reflecting the changes in v or speed as time progresses.
Q4: What does the slope of a v – t graph indicate?
A4: The slope of a v – t graph represents the acceleration of an object. A steeper slope indicates a greater acceleration, while a flatter slope indicates a smaller acceleration. The slope can be calculated by dividing the change in velocity by the change in time.
Q5: How can we determine the displacement from a v – t graph?
A5: To determine the displacement from a v – t graph, you need to find the area under the graph. The displacement is equal to the area between the graph and the time axis. If the graph lies above the time axis, the displacement is positive, and if it lies below, the displacement is negative.
Q6: What does a horizontal line on a v – t graph indicate?
A6: A horizontal line on a v – t graph indicates that the object is moving at a constant velocity or speed. This means that there is no acceleration, and the object maintains a steady rate of motion.
Q7: How can we determine the acceleration from a v – t graph?
A7: The acceleration from a v – t graph can be determined by calculating the slope of the graph. If the v – t graph is a straight line. The acceleration is constant and can be found by dividing the change in velocity by the change in time.
Q8: What does a positive slope on a v – t graph indicate?
A8: A positive slope on a v – t graph indicates that the object is undergoing positive acceleration. This means that the object’s velocity is increasing over time.
Q9: What does a negative slope on a v – t graph indicate?
A9: A negative slope on a v – t graph indicates that the object is undergoing negative acceleration or deceleration. This means that the object’s velocity is decreasing over time.
Q10: Can a v – t graph show an object’s direction of motion?
A10: No, a v – t graph cannot directly show the direction of motion. It represents the object’s velocity or speed relative to time. To determine the direction of motion, you need additional information, such as the object’s initial direction or other indicators.
Q11: How can we interpret the shape of a v – t graph?
A11: The shape of a v – t graph provides insights into an object’s motion. For example, a steeply rising line indicates rapid acceleration, a horizontal line implies constant velocity and a downward slope suggests deceleration or negative acceleration. The specific characteristics of the graph shape depend on the object’s motion.
You may also like to read: