What is Physics Practical?
Physics practical refers to the hands-on experimentation and observation of physical phenomena to better understand and verify the principles and theories of physics. It involves conducting experiments, measurements, and data collection in a controlled environment, often using specialized equipment and instruments.
Additionally, Physics practical is very important because it helps students understand and apply theoretical concepts in real situations. They enable hands-on learning, by allowing students to directly interact with materials and equipment. Physics practicals foster a deeper comprehension of physics principles by both teachers and students.
Through experiments, students can verify theoretical predictions, develop problem-solving skills, and learn how to gather and analyze data. Practical work also cultivates critical thinking by encouraging students to make observations, draw conclusions, and even refine their hypotheses.
Moreover, physics practicals nurture essential laboratory skills, such as measurement accuracy and safety protocols, which are valuable in scientific research and various careers. Overall, practicals bridge the gap between theory and practice. It enhances students’ overall understanding and appreciation of the fundamental laws that govern our natural world.

You may also like to read:
How to Calculate and Find Capacitive Reactance
What is the difference between Theory and Experiment
When we talk about theory, we are simply referring to a statement of fact due to the availability of experimental evidence to support it. A theory may be disapproved if there is no experimental evidence to support it. Whenever we develop a theory, we must perform an experiment to ascertain its existence. By performing an experiment, we will be able to monitor and accumulate data that can support the theory we earlier came up with. The theory is an idea, while an experiment is practical that supports the existence of the idea.
How to Report a Physics Experiment
Here are the procedures one needs to follow to report a physics experiment:
- You need to come up with a title for the Experiment
- The next step is to write the aim of your experiment.
- You now mention the names of the apparatuses you use for the experiment.
- Draw a diagram of how the apparatuses were set up and label your diagram
- Draw a table for recording your data
- Fill in the table with the results you obtain from the series of individual experiments.
- State the theory of the experiment to back up your reason why the procedures and the readings are mandatory.
- Apply the equation you need to make certain calculations to come up with your readings
- Draw your graph
- Find the gradient or slope of the graph
- In some cases, you may also need to apply the result from your slope to make calculations. The formula will be given to you.
- State the precautions you observed while carrying out the practical to get an accurate reading.
- You also need to avoid common errors while carrying out a physics experiment.
- Additionally, you need to wear a lab coat before entering the Physics Laboratory. You need to focus on your practical skills to avoid making unnecessary mistakes.
How to Plot and Calculate a Graph
To plot a beautiful graph, you will need to maintain calmness and concentrate on the practical. By plotting a graph, you will understand the accuracy of your data. The aim of plotting a graph is to show the relationship between variable quantities during physics practicals. After plotting a graph, you will need to find the following:
- Gradient or slope
- The intercept on the x-axis or y-axis.
- Apply any of the formulas they give you to make your deductions.
The items you will need to plot a graph include:
- A set of mathematical set
- A sharp pencil
- A transparent ruler
- A razor or sharpener
- A neat graph book
- A broomstick for drawing curves
- A biro
What types of graphs we can plot?
To understand how to conduct physics practicals, we must first know three types of graphs and they are:
- Straight line graphs
- A parabola or quadratic curve
- An inverse graph
How to Calculate the Slope or Gradient of a Graph
To find a slope of a graph, follow the following steps:
- On the graph, there is an x-axis and a y-axis
- They form a plane
- The y-axis is on the vertical line of the graph
- Also, the x-axis is on the horizontal line of the graph
- The y-axis is connected to the x-axis at the zero point
- Also, the line that goes up, starting from zero is a positive y-axis
- Additionally, the line that goes right, starting from zero is a positive X-axis
- We also have another line that moves down. This is a negative y-axis.
- From the left side of the plane, we have a negative X-axis
- Indicate your readings on the appropriate axis (y-axis and x-axis)
- Use a transparent ruler to connect the readings on the y-axis and the x-axis
- Apply the same ruler to draw a straight line between the two axis
- Ensure to apply pencil throughout your work
- Select two points on the line you have drawn with the ruler
- Connect the two lines to find your slope
- You need to know that Y = mx + c, where c is the intercept.
- This is how to calculate your slope by using [ Slope, S = (y2 – y1) / (x2 – x1)]
- The plane is as (x , y)
- You can show coordinate points as M (x2 – x1) and N (y2 – y1)
- Subtract y1 from y2
- Also, subtract x1 from x2
- Divide (y2 – y1) by (x2 – x1) to get the slope
- We also know slope as a gradient
How to Find an Intercept on a Graph
To find an intercept, you will have to extend the plotted line to cut through the y-axis or x-axis. The scale at which the plotted line cuts through any of the axis is the intercept of the graph. The graph should start from the origin at (0,0) for you to find the intercept.
What are the Common Errors you Might Notice During Physics Practical
The common errors you need to avoid while carrying out physics practicals are:
- Systematic Errors
- Random Errors
- Erratic Errors
- Zero Errors
- Systematic Error is an error due to unforeseen circumstances like faulty lab apparatus and a blowing fan.
- Random error is an error caused by poor judgment while reading the data.
- Erratic error is the type of error due to a lack of focus by the person doing the experiment.
- Zero error is the type of error due to a bad pointer in an apparatus or faded calibration.
How to Solve Physics Practical Questions
To solve physics practical questions, follow these steps:
- Read Carefully: Understand the problem and what’s being asked. Note down given values.
- Identify Concepts: Figure out the relevant physics concepts involved, like motion, forces, electricity, etc.
- Formulas: Know the applicable formulas for the concepts. Match them with given values.
- Calculate: Plug values into the formulas and calculate the result.
- Units & Accuracy: Check units for consistency (e.g., meters, seconds). Round off to appropriate decimal places.
- Graphs (if needed): Plot data points on a graph. Choose suitable scales. Draw the best-fit line or curve.
- Interpretation: Analyze results. What do the numbers/graphs show? Draw conclusions.
- Error Analysis: Consider potential errors. Were measurements accurate? Calculate percentage error if needed.
- Compare & Discuss: If required, compare with theoretical expectations. Discuss any discrepancies.
- Conclusion: Summarize findings. State what you’ve learned or any improvements.
- Presentation: Neatly present the answer, including diagrams or graphs if applicable.
- Practice: Practice various problems to improve problem-solving skills.
Remember, physics practical questions often test your understanding of concepts, application of formulas, and analytical skills. Take your time, and step-by-step, you’ll become better at tackling these questions.
A sample of How to Conduct Physics Practical
Here is a sample of a question and answer on how to conduct physics practicals from West African Examination Council (WASSCE) – 2008
Question
You are provided with a uniform meter rule, a knife edge, masses, and other necessary apparatus.
- Suspend a meter rule horizontally on the knife edge. Read and record the point of balance G of the meter rule. keep the knife edge at this point throughout the experiment.
- Using the thread provided, suspend the object labeled W at the 15cm mark of the meter rule.
- Suspend a mass M of 20g on the other side of G. Adjust the position of the mass until the meter rule balances horizontally again.
- Read and record the position Y of the Mass M on the meter rule.
- Determine and record the distance L between the mass and G. Also, determine and record the distance D between W and G.
- Repeat the procedure for four other values of M = 30, 40, 50, and 60g. In each case, ensure that W is kept constant at the 15cm mark and the knife edge at G.
- Evaluate L-1 in each case. Tabulate your readings.
- Plot a graph of M on the vertical axis against L-1 on the horizontal axis
- Determine the slope, S, of the graph.
- Evaluate S/D
- State two precautions are taken to obtain accurate results.
Solution
Here is the solution to the above question
Aim of the practical
An experiment to determine the equilibrium of a meter rule with several masses.
Table for the experiment
where G = 49.50cm, D = 34.50cm
| M(g) | Y(cm) | L(cm) | L-1 (cm-1) |
| 20.00 | 99.25 | 49.75 | 0.020 |
| 30.00 | 84.00 | 34.5 | 0.030 |
| 40.00 | 75.37 | 25.87 | 0.040 |
| 50.00 | 70.20 | 20.70 | 0.050 |
| 60.00 | 66.75 | 17.25 | 0.060 |
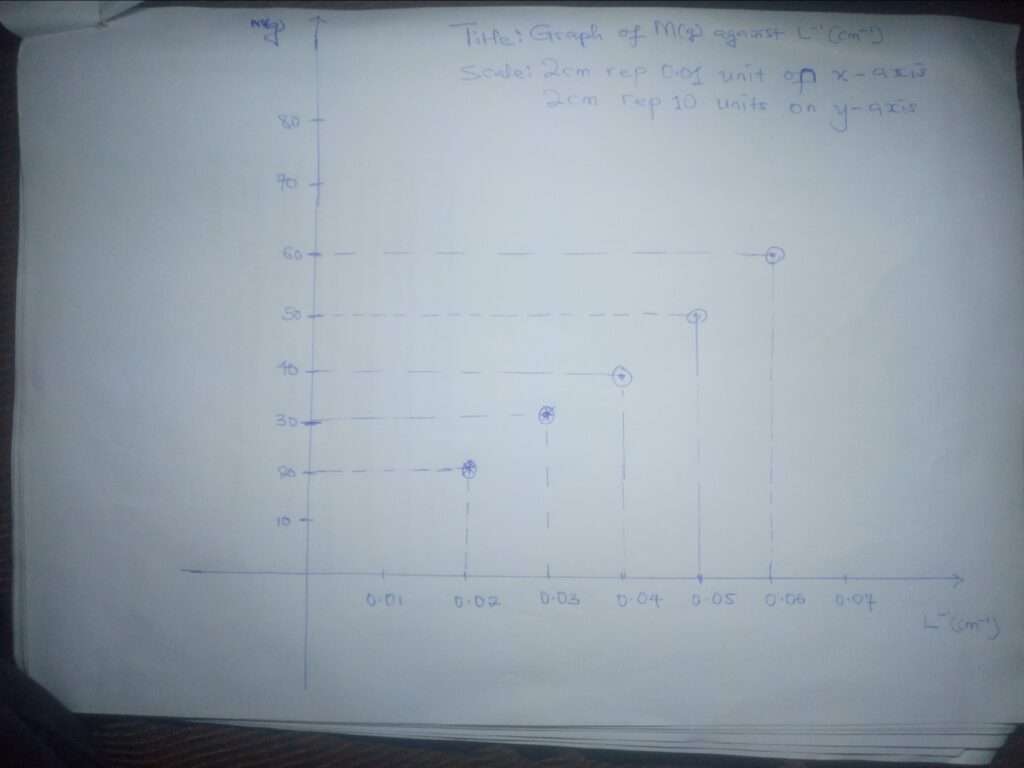
Slope
To find the slope, we say
S = (y2 – y1) / (x2 – x1)
Therefore, the slope, S, is equal to
S = (60 – 20) / (0.05 – 0.02)
S = 1333.3gcm
To find S/D we now say
S/D = 1333/34.5 = 35
Precautions
- I ensure that all fans are switched off to avoid breeze from affecting the stability of the meter rule
- I ensured that the mass is properly hung on the required calibration.
What is Physics Practical Lab?
A physics practical lab is a hands-on learning space where students perform experiments to understand and apply concepts from physics. It’s like a playground for learning physics by doing. Inside the lab, you will find tools and equipment like rulers, weights, and machines. Students follow instructions to set up experiments, measure things like distance and time, and record results.
They might test how things move, collide, or interact with forces. The lab helps students see physics in action and learn by trying things themselves. It’s a place where theories become real and exciting discoveries happen!
Frequently Asked Questions (FAQs) – Physics Practical
1. What is a physics practical?
A physics practical refers to hands-on experiments and activities conducted in a laboratory setting to explore and understand various concepts and principles of physics through direct observation and measurement.
2. Why are physics practicals important?
Physics practicals are important because they provide students with a tangible understanding of theoretical concepts. They enhance critical thinking, problem-solving skills, and allow students to apply theoretical knowledge in their daily activities.
3. What do physics practicals involve?
Physics practicals involve conducting experiments, making measurements, analyzing data, and drawing conclusions. These activities covers important topics, such as mechanics, optics, electricity, magnetism, thermodynamics, and more.
4. How are physics practicals conducted?
Physics practicals are typically conducted in a controlled laboratory environment. Students follow specific procedures outlined in the experiment instructions, use equipment and instruments, gather data, and often work in groups.
5. What equipment is used in physics practicals?
Physics practicals utilize different equipment, including rulers, Vernier calipers, microscopes, pendulums, mirrors, lenses, resistors, capacitors, voltmeters, ammeters, and various specialized apparatus for specific experiments.
6. Are physics practicals safe?
Yes, safety is a top priority during physics practicals. Laboratories are equipped with safety measures, such as safety goggles, lab coats, and emergency equipment. Students are instructed on proper handling of equipment and materials to minimize risks.
7. Can physics practicals be done at home?
Some physics practicals can be adapted for home settings, but certain experiments may require specialized equipment or safety precautions that might not be feasible at home.
8. How do physics practicals relate to theory?
Physics practicals provide a concrete demonstration of theoretical concepts. They help students visualize and validate theoretical ideas. Experiments promote deeper understanding of the subject.
9. How are physics practicals evaluated?
Physics practicals are often evaluated based on the accuracy of measurements, the adherence to experimental procedures, the analysis of data, the quality of conclusions drawn, and sometimes through written reports or presentations.
10. Can physics practicals be challenging?
Yes, physics practicals can be challenging due to the precision required in measurements, the complexity of equipment, and the need to troubleshoot unexpected outcomes. However, they offer valuable learning experiences.
11. Are there any online resources for physics practicals?
Yes, there are various online platforms that provide virtual physics simulations and interactive experiments, allowing students to practice and learn physics concepts remotely.
12. Do physics practicals only apply to students pursuing physics degrees?
No, physics practicals are beneficial for students across various science disciplines. They promote skills like critical thinking, data analysis, and problem-solving that are applicable in many fields.
13. Can physics practicals inspire a career in physics?
Absolutely, engaging with physics practicals can spark an interest in pursuing a career in physics or related fields, as they provide a firsthand experience of the excitement and challenges of scientific exploration.
14. How can I excel in physics practicals?
To excel in physics practicals, focus on understanding the underlying concepts, practicing precise measurements, improving your data analysis skills, and seeking guidance from instructors or peers when needed.
15. Are there any famous physics experiments?
Yes, there are several iconic physics experiments like the double-slit experiment, the Michelson-Morley experiment, and the Millikan oil drop experiment, which have significantly contributed to shaping our understanding of the physical world.